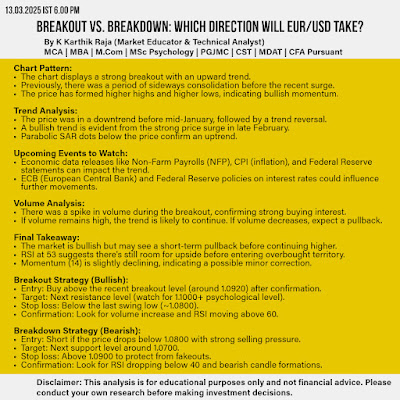
Chart Pattern:
- The chart displays a strong breakout with an upward trend.
- Previously, there was a period of sideways consolidation before the recent surge.
- The price has formed higher highs and higher lows, indicating bullish momentum.
Trend Analysis:
- The price was in a downtrend before mid-January, followed by a trend reversal.
- A bullish trend is evident from the strong price surge in late February.
- Parabolic SAR dots below the price confirm an uptrend.
Upcoming Events to Watch:
- Economic data releases like Non-Farm Payrolls (NFP), CPI (inflation), and Federal Reserve statements can impact the trend.
- ECB (European Central Bank) and Federal Reserve policies on interest rates could influence further movements.
Moving Averages Insights:
- Green line (200 SMA): Price has crossed above the long-term moving average, confirming a bullish breakout.
- Orange & red lines (short-term MAs): These are sloping upwards, indicating a shift in momentum.
- The crossover of shorter MAs above longer MAs supports a bullish outlook.
Volume Analysis:
- There was a spike in volume during the breakout, confirming strong buying interest.
- If volume remains high, the trend is likely to continue. If volume decreases, expect a pullback.
Final Takeaway:
- The market is bullish but may see a short-term pullback before continuing higher.
- RSI at 53 suggests there's still room for upside before entering overbought territory.
- Momentum (14) is slightly declining, indicating a possible minor correction.
Breakout Strategy (Bullish):
1. Entry: Buy above the recent breakout level (around 1.0920) after confirmation.
2. Target: Next resistance level (watch for 1.1000+ psychological level).
3. Stop loss: Below the last swing low (~1.0800).
4. Confirmation: Look for volume increase and RSI moving above 60.
Breakdown Strategy (Bearish):
1. Entry: Short if the price drops below 1.0800 with strong selling pressure.
2. Target: Next support level around 1.0700.
3. Stop loss: Above 1.0900 to protect from fakeouts.
4. Confirmation: Look for RSI dropping below 40 and bearish candle formations.

No comments:
Post a Comment